Our Site
Cycle Length Graph
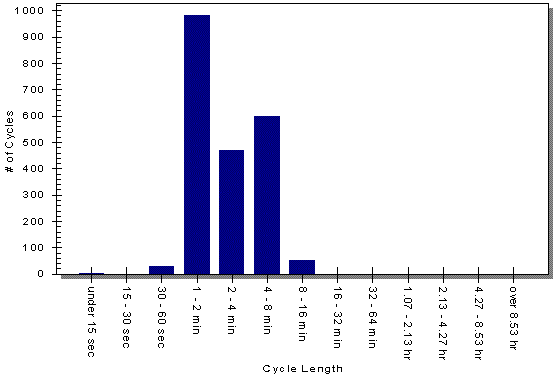
Here is a sample of the Cycle Length graph that is produced by the WatchLink software:

Along the horizontal axis are a number of cycle length bins. The vertical axis shows how many on-cycles occurred for each cycle length bin. The graph above was produced by monitoring a boiler for about 3 weeks. The graph shows that, during that monitoring period, about 980 boiler on-cycles occurred that were 1 to 2 minutes in length.
Copyright © 2006. If you have questions or comments, please send mail to info@energytools.com.