Our Site
Part-Load Profile Graph
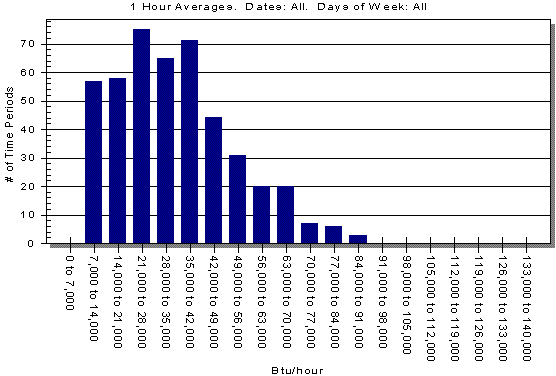
Here is a sample of the Part-Load Profile graph that is produced by the WatchLink software:

This graph was produced after monitoring a boiler for about 3 weeks. It shows how many hours occurred during which the boiler was loaded to a particular level. For example, there were 20 hours during which the boiler used from 63,000 to 70,000 Btu/hour of fuel. The graph also shows that during the worst hour of the monitoring period, the boiler used from 84,000 to 91,000 Btu/hour of fuel. This is useful for determining the proper size for the boiler.
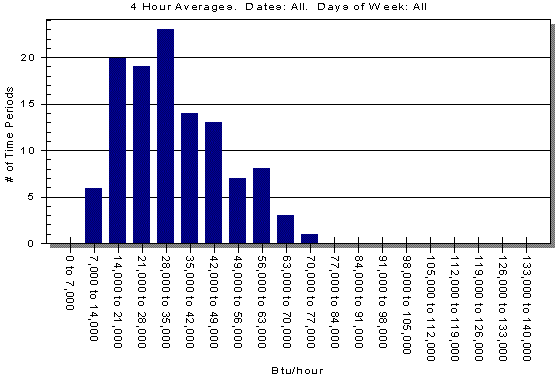
The above graph used data from one hour intervals. You can also view the same type of graph, but use longer intervals to average the fuel use over. The graph below shows fuel use measured over 4 hour intervals:

This graph shows that during the worst four hour period, the boiler used between 70,000 - 77,000 Btu/hour of fuel.
Copyright © 2006. If you have questions or comments, please send mail to info@energytools.com.